While a drone simply captures imagery, there are a number of different outputs that can be produced from the images, making them useful for a multitude of applications.
Here’s a quick overview of the most common types of GIS outputs with a few examples of how they can be used.
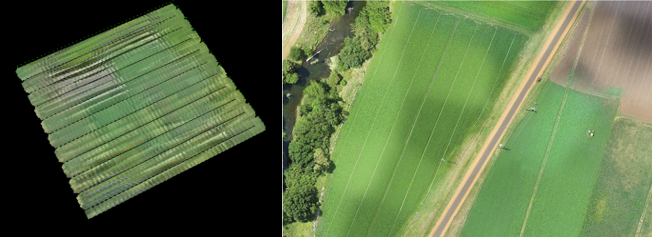
Orthomosaic / Orthophoto:
Also referred to as an Ortho, this is generated from thousands of images stitched together (left image below) to show one large high-resolution 2D image with measurable qualities (right image below).
The resolution of an Ortho is specified in GSD (Ground Sampling Distance). For example, a 5cm Ortho means that every pixel in the image represents 5cm on the ground. It is geometrically corrected to ensure a uniform and accurate scale, so it can be used to calculate accurate distances.
An ortho typically shows a top-down / birds-eye-view of a site and is most commonly used as the background to a topographic map which shows different features of the land and is an essential tool in planning and development.
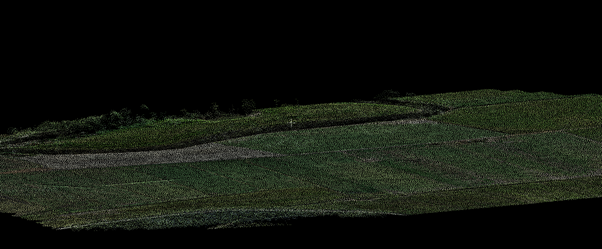
Point Cloud:
A point cloud is a set of 3-dimensional data points (defined by x, y and z coordinates).
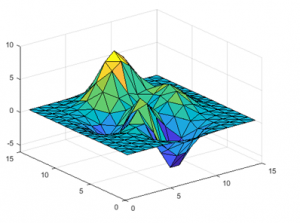
These points can be triangulated (Figure 1) to produce a model of the surface based on each point’s elevation value i.e. Digital Surface Model
A classified point cloud means that natural and man-made objects have been categorised, and can be filtered out to reveal only the ground points i.e. Digital Terrain Model.
Figure 1
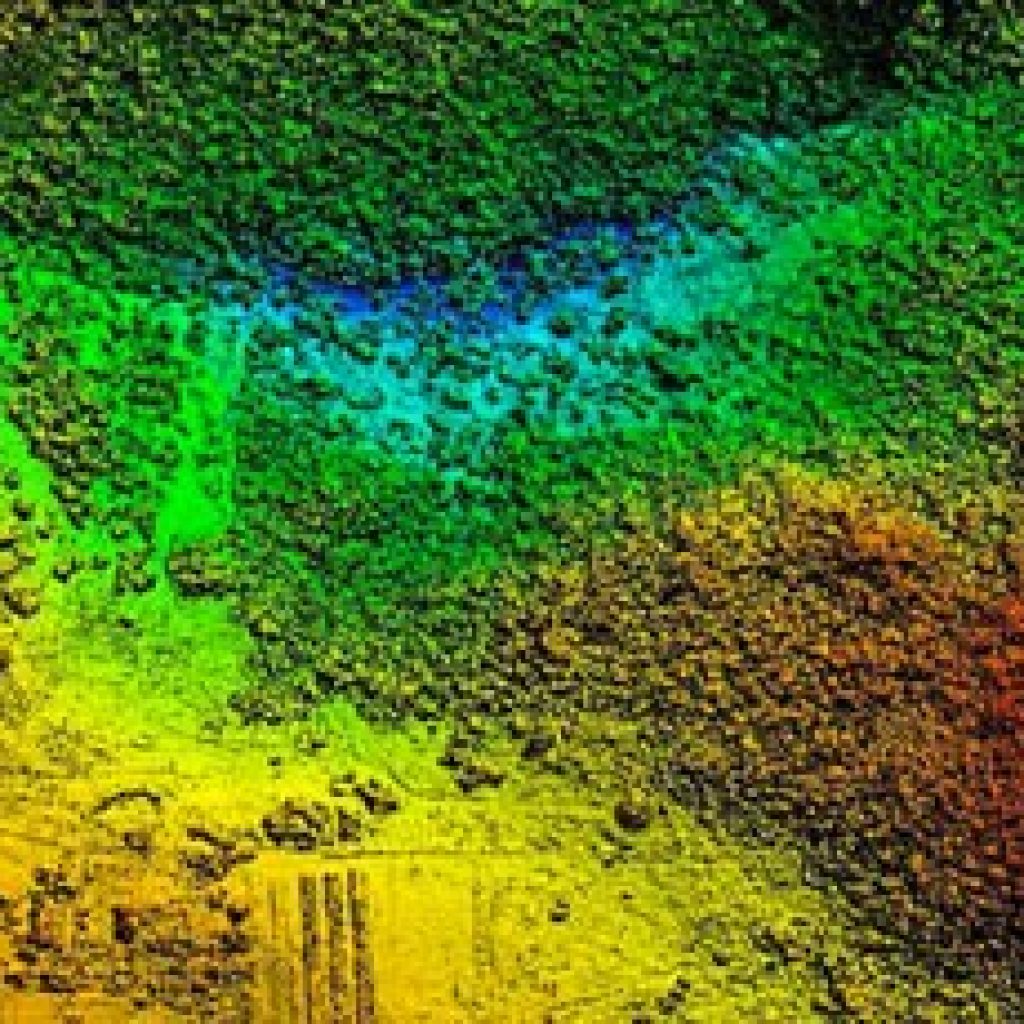
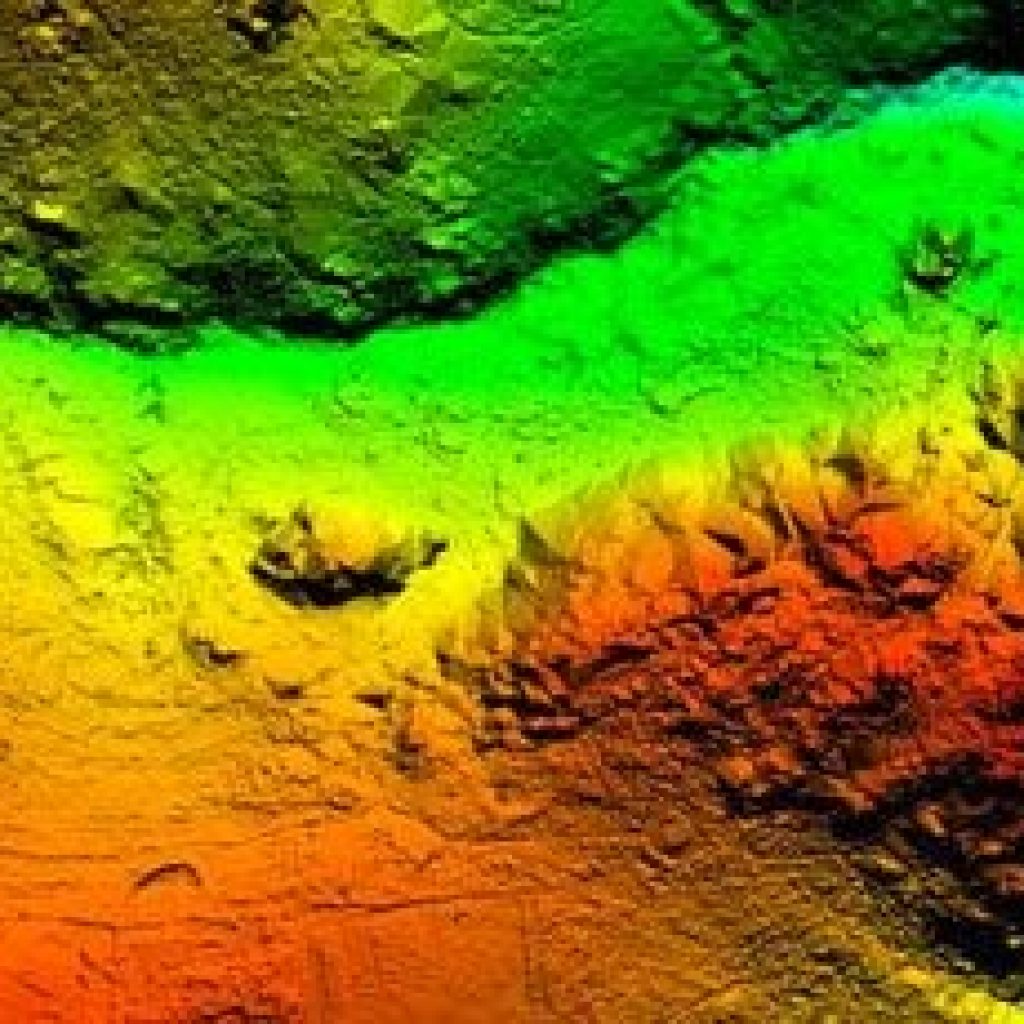
Digital Surface Model:
A digital surface model represents the surface of the land including all natural and built features (trees, rocks, buildings, machinery).
DSMs are useful in analysing terrain for urban planning – like checking how a proposed structure would obstruct views or detecting vegetation encroachment on power lines. They can also used for identifying mine stockpiles for volume calculations.
Digital Terrain Model:
When non-ground points (trees, buildings, structures etc) are filtered out leaving only bare-earth, a model of this surface is represented by a digital terrain model – a clear visual of the ground surface only.
A DTM is particularly useful in planning with respect to hydrology (flood & drainage analysis), soils and land-use/development.
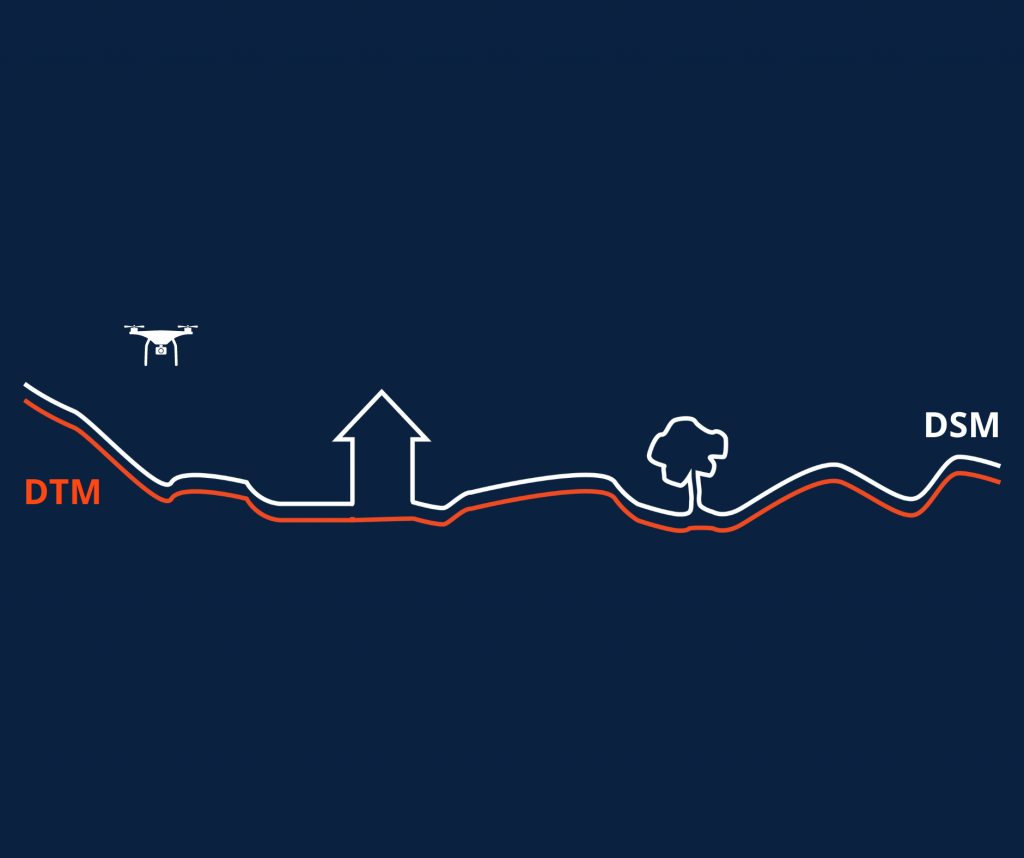
DSM vs DTM:
This diagram shows the difference between a DSM and DTM surface.
DSM and DTM are different types of Digital Elevation Models (DEMs)
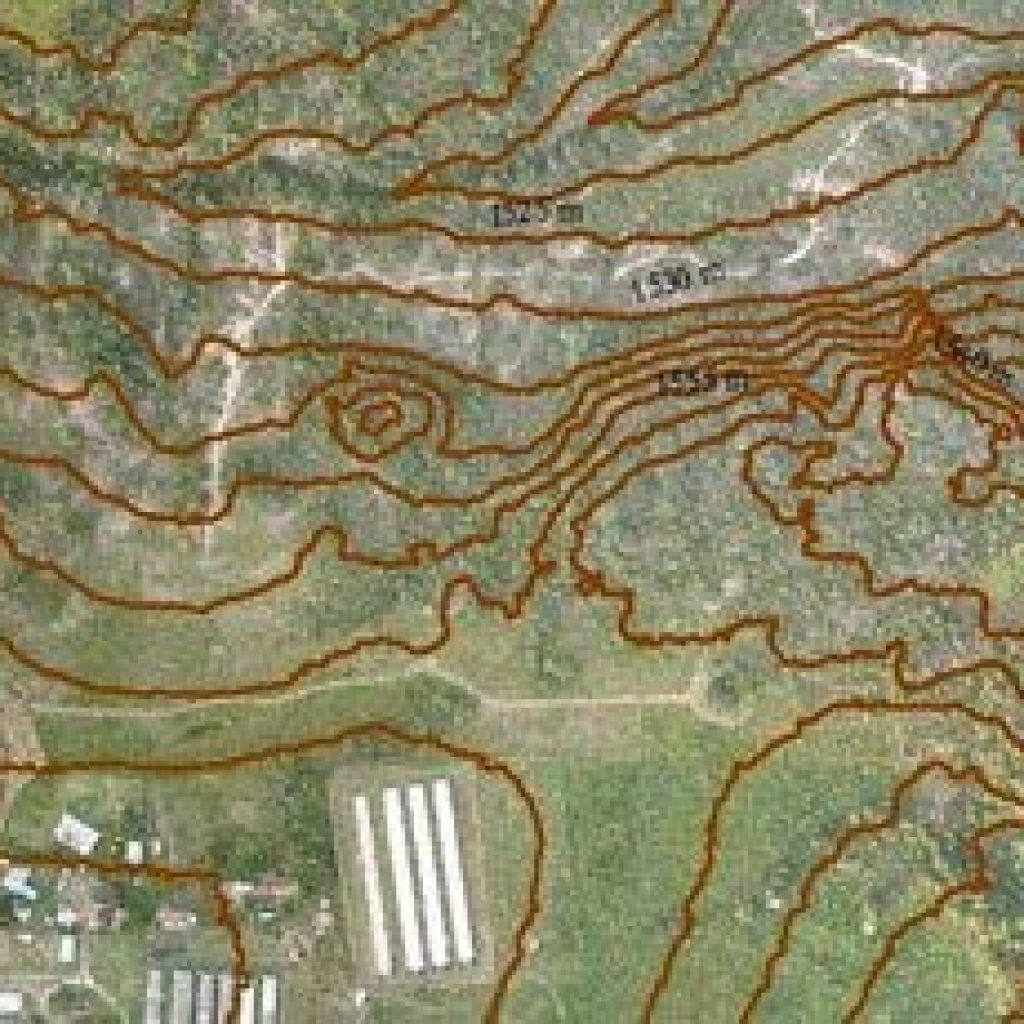
Contours:
Contours are lines that connect points of equal elevation values. The contour interval is the vertical distance between contour lines.
Contours visually depict the layout of the terrain- lines with wide spacing indicate flat areas while lines close together represent steeper slopes.
Contours are used to show topography on a map and to understand terrain elevations.
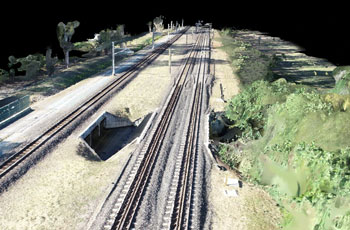
3D Model:
A 3D model is a representation of a real object or scene. 3D models show heights/elevations, not just the location of features and allow you to make highly accurate measurements off the digital model.
Depicting real world environments helps in planning and understanding patterns over time. A reality model of a structure or asset, also known as its digital twin, is useful in developing asset inventories, inspecting for defects or in planning further development of the asset.
The power of drone capture lies in the ability to extract valuable information from the data. We pride ourselves on providing valuable insights in formats that are usable and accessible. Typically, each of these data outputs requires licensed GIS software to view and use the files, so if you do not have access to software, we can arrange alternative ways of visualising these outputs to suit your requirements.
Common GIS Data Outputs2021-03-012021-03-02https://www.scoutaerial.com.au/wp-content/uploads/2022/10/01-scoutaerialaustralia_2022_logo_master.pngScout Aerial Australiahttps://www.scoutaerial.com.au/wp-content/uploads/2021/03/dtm.jpg200px200px